QTC Sensor Hysteresis vs. Drift: How to Test Repeatability
QTC sensor hysteresis vs. drift describes two different ways a pressure sensor can produce unequal readings even when the applied force seems unchanged. Hysteresis means the reading at a given force depends on whether the force is increasing or decreasing. Drift means the reading changes over time while the force is held approximately constant.
Both matter in quantum tunnelling composite (QTC) sensing, especially when converting electrical resistance into an estimated force. A laboratory study of a QTC pill reported hysteretic and nonlinear behaviour. Performance cannot be assumed identical for every QTC sheet, pill or manufactured module.
Hysteresis vs. Drift vs. Repeatability
| Term | What changes? | How to test it |
|---|---|---|
| Hysteresis | Output differs between loading and unloading at the same force | Record an up-and-down force cycle |
| Drift | Output changes during a fixed-force hold | Maintain load and sample over time |
| Repeatability | Repeated trials vary under nominally the same setup | Repeat identical cycles and compare spread |
| Baseline shift | Unloaded reading does not return to its previous level | Measure before and after several cycles |
There is overlap: viscoelastic polymers, contact geometry, ambient temperature and circuit noise can affect several metrics. Research on force-sensing resistors identifies both drift and hysteresis as common error mechanisms; the 2024 review of resistive sensor errors is useful context.
What You Need for a Controlled Test
- A specified QTC sensor and its manufacturer’s safety and operating data
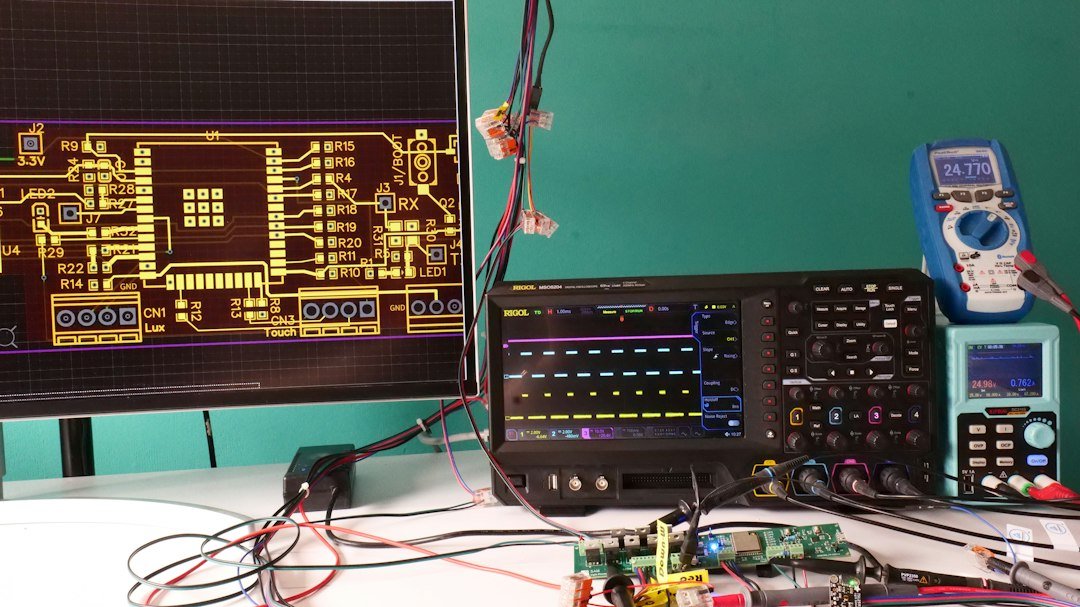
- A stable low-voltage readout circuit or manufacturer-approved interface
- A fixture applying distributed, repeatable force rather than finger pressure
- A suitable load reference such as calibrated weights or a force gauge
- A timer and spreadsheet for raw voltage, ADC value or resistance
Read our QTC Arduino voltage-divider guide if you need an introductory low-voltage analog-readout example. Never exceed the sensor or microcontroller’s electrical and mechanical ratings.
Test 1: Make a Hysteresis Curve
- Mount the sensor in its final contact arrangement, ideally with a flat, fixed-size loading surface.
- Record the unloaded baseline after allowing the device to settle.
- Increase force through five safe, evenly spaced load steps; take several readings at each.
- Decrease force through the same steps at approximately the same rate.
- Graph output on the vertical axis against force on the horizontal axis. Plot loading and unloading as separate series.
Illustrative numbers only: at 2 newtons, suppose a loading measurement is 1.80 V and an unloading measurement is 2.05 V. The branch difference is 0.25 V at that force. That is a real comparison you can report; it is not yet a percentage of force error unless you specify a normalization and calibration model.
For the nonlinear QTC force–resistance relationship, see how to read a QTC force–resistance graph.
Test 2: Measure Drift Under a Constant Load
- Apply a moderate, safe test load with the same fixture.
- Record the sensor output as soon as the load stabilizes.
- Record again at consistent intervals—for example at 10, 30, 60, 120 and 300 seconds.
- Keep temperature, supply voltage and cable connections as stable as practical.
- Remove the load and measure how close the baseline returns to its starting value.
Use a consistent signal representation. For example, relative voltage drift (%) = 100 × (Vlater − Vinitial) / Vinitial when the initial voltage is nonzero. That formula is not interchangeable with percentage drift in resistance or in conductance; state which variable you measured.
Test 3: Check Repeatability and Recovery
Repeat the same loading-and-unloading cycle at least several times without rearranging the fixture. For each target force, record the mean, minimum, maximum and spread of results. Then remove and remount the sensor and repeat separately; remounting variation is a practical concern in wearables.
| Log column | Why it matters |
|---|---|
| Trial number and direction | Separates loading from unloading |
| Applied force and contact area | Makes the mechanical input reproducible |
| Elapsed time at force | Distinguishes quick response from slow creep |
| Voltage, ADC code or resistance | Preserves raw sensor evidence |
| Temperature and supply voltage | Helps identify confounding changes |
What Can Distort Your Results?
Finger pressure is not a calibrated force. Uneven contact redistributes pressure. Different wait times mix creep with force response. Temperature and moisture can change flexible sensor performance. A 2026 review of wearable-sensor reliability highlights how environmental stress can increase drift and hysteresis.
Can Software Remove Hysteresis and Drift?
Software can sometimes fit separate loading and unloading calibration curves, smooth noisy measurements or estimate time-dependent change. But if the fixture moves or the sensor’s properties vary unpredictably, filtering may conceal rather than correct the source of error. Report raw data alongside corrected results, and validate with force values not used to build the model.
Frequently Asked Questions
Is hysteresis the same as a delayed sensor response?
No. A slow response is about timing after a force change; hysteresis is a difference between loading and unloading curves at the same force.
Does every QTC sensor have the same error?
No. Formulation, geometry, mechanical mounting and electronics determine the actual results.
Can this test calibrate a medical pressure device?
It is an educational characterization method, not a validation protocol for clinical or safety-critical use.
Sources: QTC pill characterization (IEEE); Resistive sensor errors (2024); Wearable sensor reliability (2026). Related: QTC fundamentals.